Debugging Vaadin client widgets
Submitted on 25 May 2012When working with standard Vaadin components, you can rely on your prefered IDE’s debugger to help you when something unexpected happens. When integrating add-ons with widgets, chances are that something won’t work on the client side sooner or later. In this case, IDE debugging won’t help and we need something else.
This something else is GWT hosted mode. The first step to enable this feature is to create a launch in Eclipse. In order to that, right-click on your Eclipse project and choose Properties. In the opening pop-up, select the Vaadin menu (type “Vaadin” in upper left field if you need to reduce the number of menu entries).
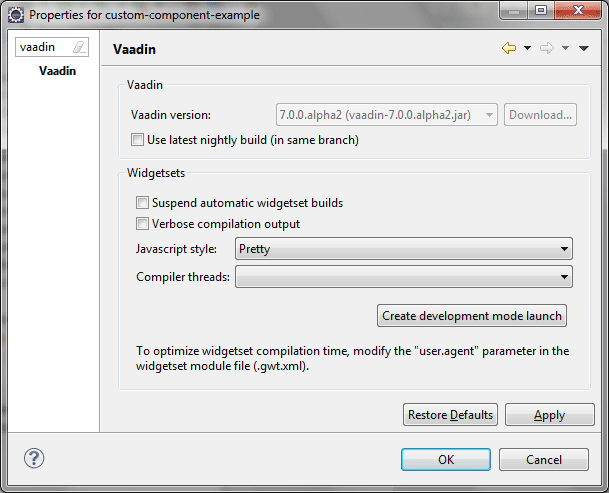
Click on the Create development mode launch button: this creates a .launch file at the root of the project. Right click on it and choose Debug as ‘GWT hosted mode’. This launches the GWT development mode window. Subsequent runs can be directly started from the Debug configurations tool item.
The second step is to use PRETTY style compilation, either through the previous screen or through Maven, depending on your approach.
The third step is optional but recommended. Since there will be a lot of debugging, updating code and compiling to JavaScript cycles, it will speed them up to compile only for the browser you’re currently using. Locate your gwt.xml file and insert the following snippet:
1
<set-property name="user.agent" value="safari" />
This will set the user agent to Chrome (as well as you guessed, Safari).
The fourth step consists of installing the corresponding plugin in your browser.
Launch the application in an embedded server inside Eclipse. Paste the following URL in your browser http://localhost:8080/custom?gwt.codesvr=127.0.0.1:9997.
Either use Google Chrome (or Chromium if you value your privacy). Of course, port and context-root should be customized according to your configuration. Follow the displayed instructions to install the GWT Developer plugin.
Note that Internet Explorer download link doesn’t work and that Mozilla Firefox version should be comprised between 3.0 and 10.0 for an available plugin to be found.
From this point on, you get two main assets while debugging:
- The GWT Development console shows you a bunch of log messages that were previously eaten away. That means you can call
GWT.log()in your own code and see the message in the console.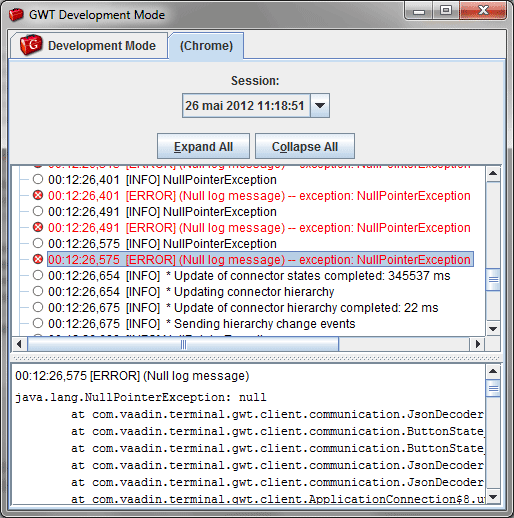
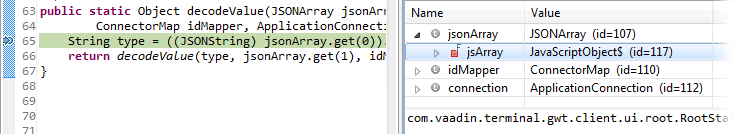
- You can set breakpoints in Eclipse in client-side code, and expects the execution to stop at these, just like in regular server-side code. With this, you have access to the method calls stack as well as variable values.
 There’s nothing revolutionary with this technique: GWT developers use it since ages but for Vaadin developers , it’s another tool at your disposal to be able to provide top-notch UI components.

Get Learning Vaadin 7 from Packt, Amazon, Barnes and Nobles or Safari Books Online now!
Recent articles
- SASS pre-compilation Submitted on 22 Aug 2015
- The Table is dead, long live the Grid Submitted on 15 Mar 2015
- Easy theming with Valo Submitted on 07 Sep 2014
- The right usage of lambdas with event listeners Submitted on 13 Apr 2014
- Spring Boot and JavaConfig integration Submitted on 08 Mar 2014
- Dynamic Vaadin servlet registration Submitted on 06 Jul 2013
- Vaadin 7 eases your theme development Submitted on 23 Sep 2012
- Spring security integration Submitted on 25 Aug 2012
- Integrating HTML and JavaScript - part 2 Submitted on 12 Aug 2012
- Integrating HTML and JavaScript - part 1 Submitted on 28 Jul 2012
Tags: